Dashboard guides · PRO view
The weather for your work
The PRO view has everything in the Enthusiast view plus tools for each sector that end in a clear answer: what to do and when. Here is how to use them, with the usual questions applied to work.
Before you start
- 1Open the dashboard in the PRO view and search for the place: the town, the plot, the event venue.
Open the PRO view - 2Choose the sector. Above the right-hand panel: «General · 🌲 Forestry · 🎪 Events · 🚚 Transport · 🌾 Farming». Each one opens its own tool; «General» is the usual panel.
- 3Sign in with your account if you want to save cases (plots, events, routes), share them with your team and get the report by email every morning or the evening before.
What will the weather be like tomorrow for what I have to do?
Each sector answers its own question with a traffic light: No problems, Caution or Risk, and the reason why.
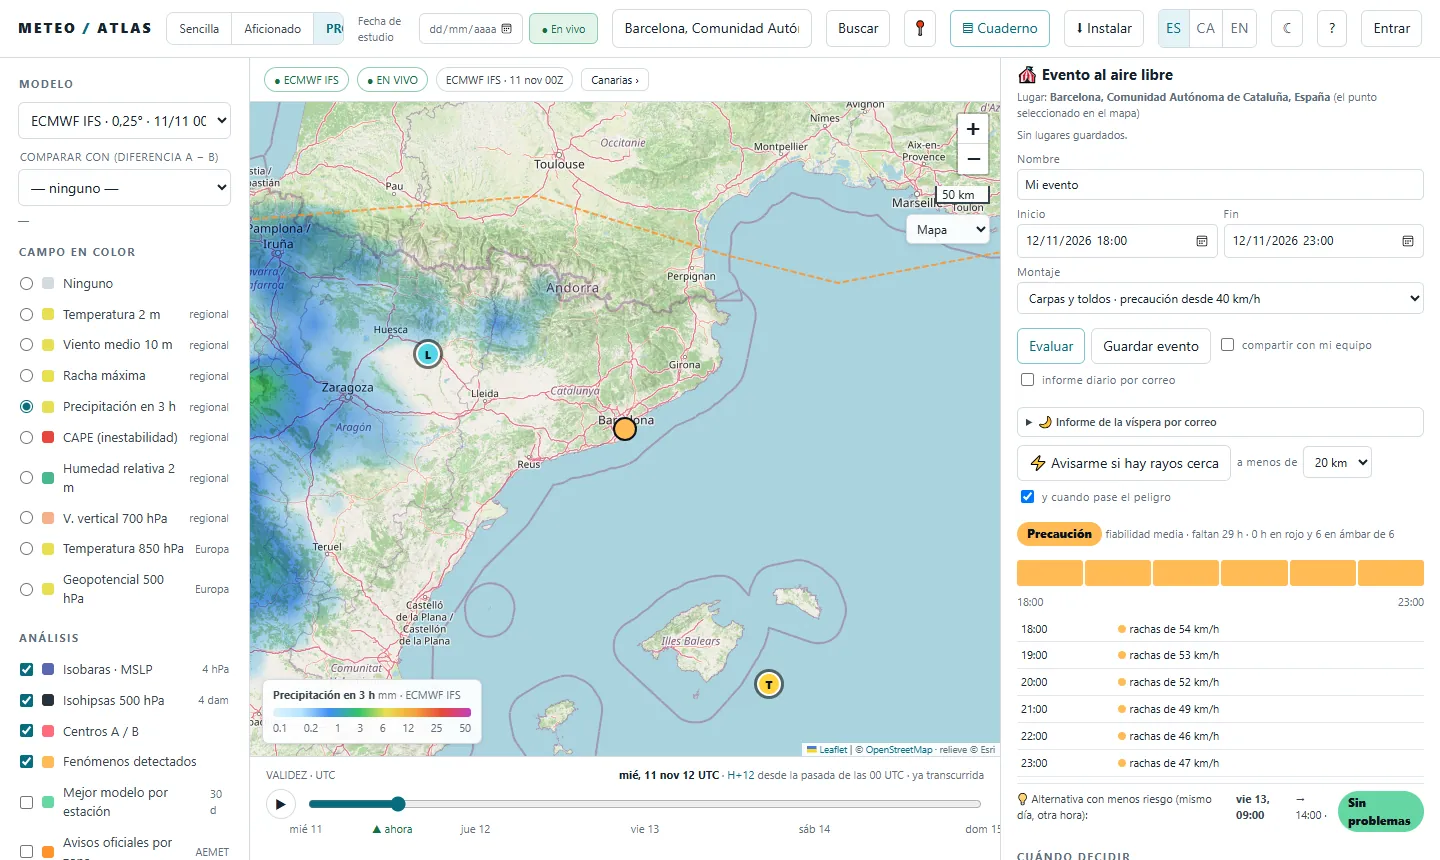
🎪 Events: shall I put up the marquee tomorrow afternoon?
- 1Put the place on the map and fill in «Name», «Start», «End» and the «Set-up» (marquees and awnings, or stage, screens and lighting towers): each one has its own wind threshold.
- 2Press «Assess». You will see the traffic light for the whole event, how many hours are left, the confidence and, hour by hour, the reason (gusts, rain, thunderstorms).
- 3Look at the «Lower-risk alternative»: another time or another day that looks better. And if you like, «⚡ Alert me if there is lightning nearby» during the event.
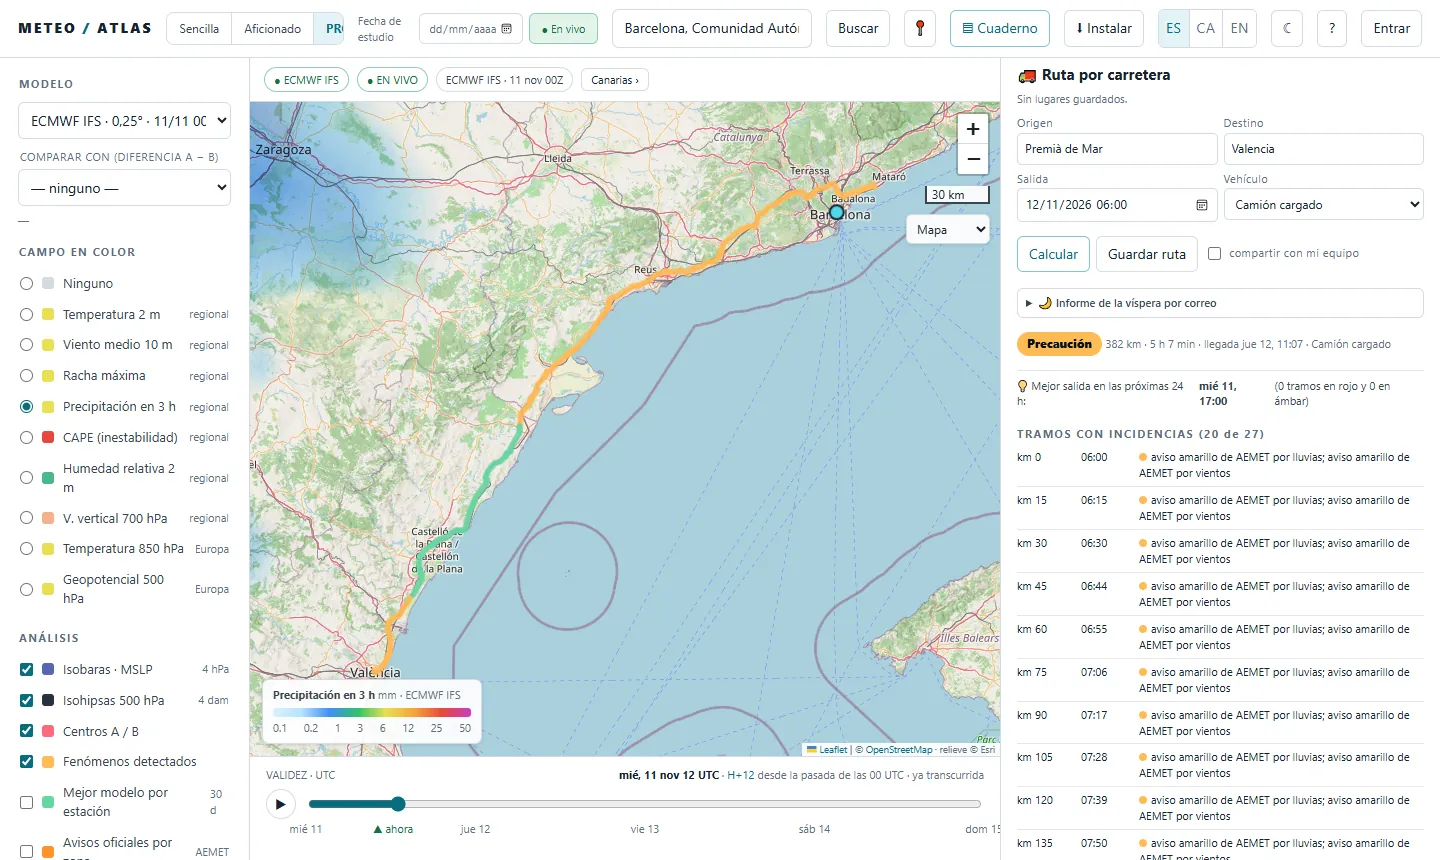
🚚 Transport: what time shall I set off with the lorry?
- 1Fill in «Origin», «Destination», «Departure» and «Vehicle» (van or car, loaded lorry, or empty lorry, curtain-sider or high-sided vehicle) and press «Calculate».
- 2Read the route. The map colours it in and the «Stretches with issues» list tells you at which kilometre, at what time you will pass and why: crosswind, heavy rain, snow or ice, AEMET warnings.
- 3Look at the «Best departure in the next 24 h» and print the «🖨 Route sheet» for the driver.
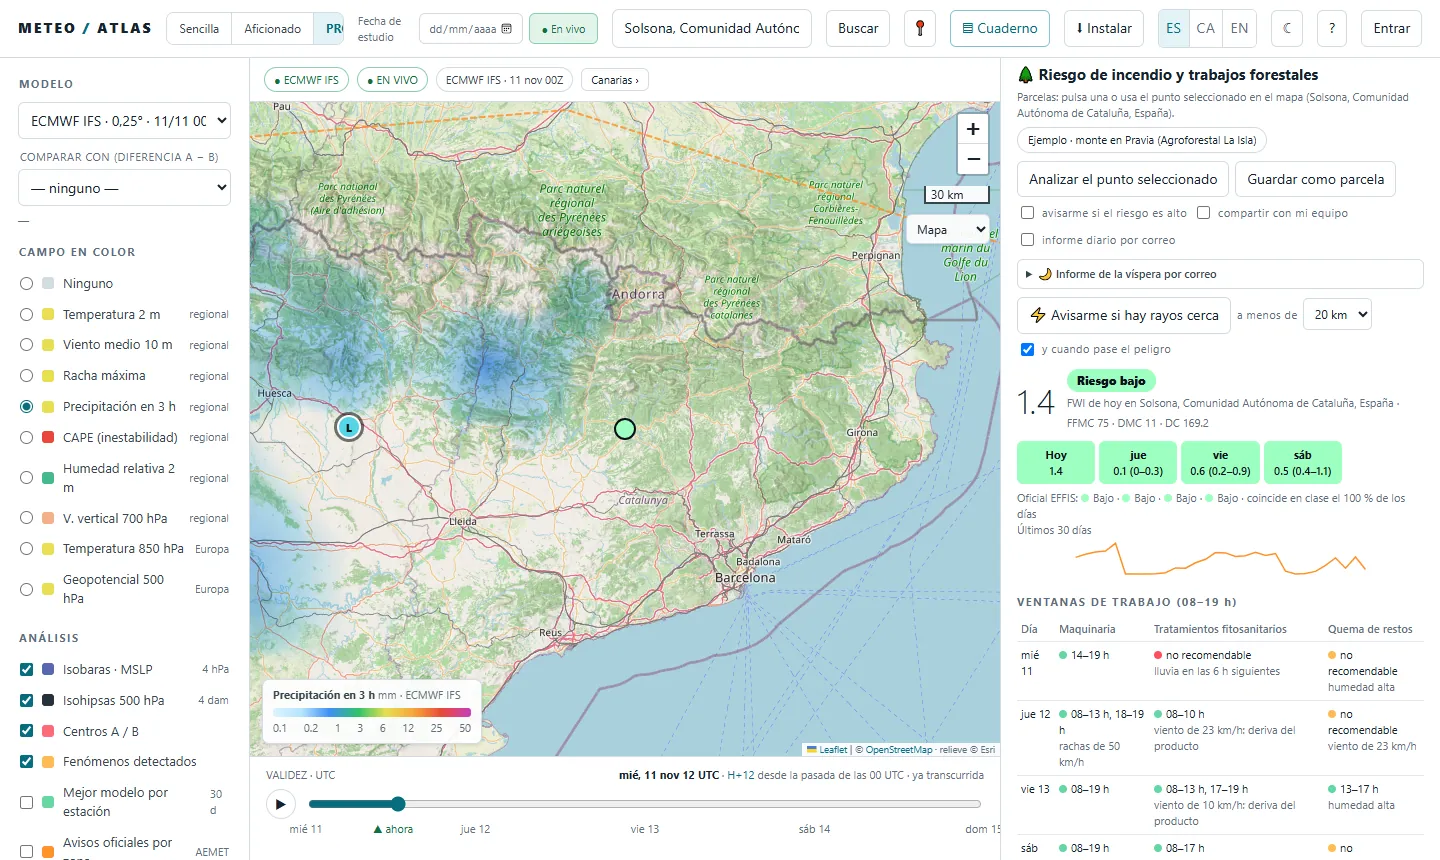
🌲 Forestry: is there a fire risk? Can I work in the forest?
- 1Find the plot and press «Analyse the selected point», or «Save as plot» to keep it for good.
- 2Read the fire risk (FWI) for today and the next three days, with the range between models and compared with EFFIS, the official European index.
- 3Look at the «Work windows (08–19 h)» for machinery, plant protection treatments and burning of debris, with the reason when it isn't a good idea. Tick «alert me if the risk is high» to get the alert.
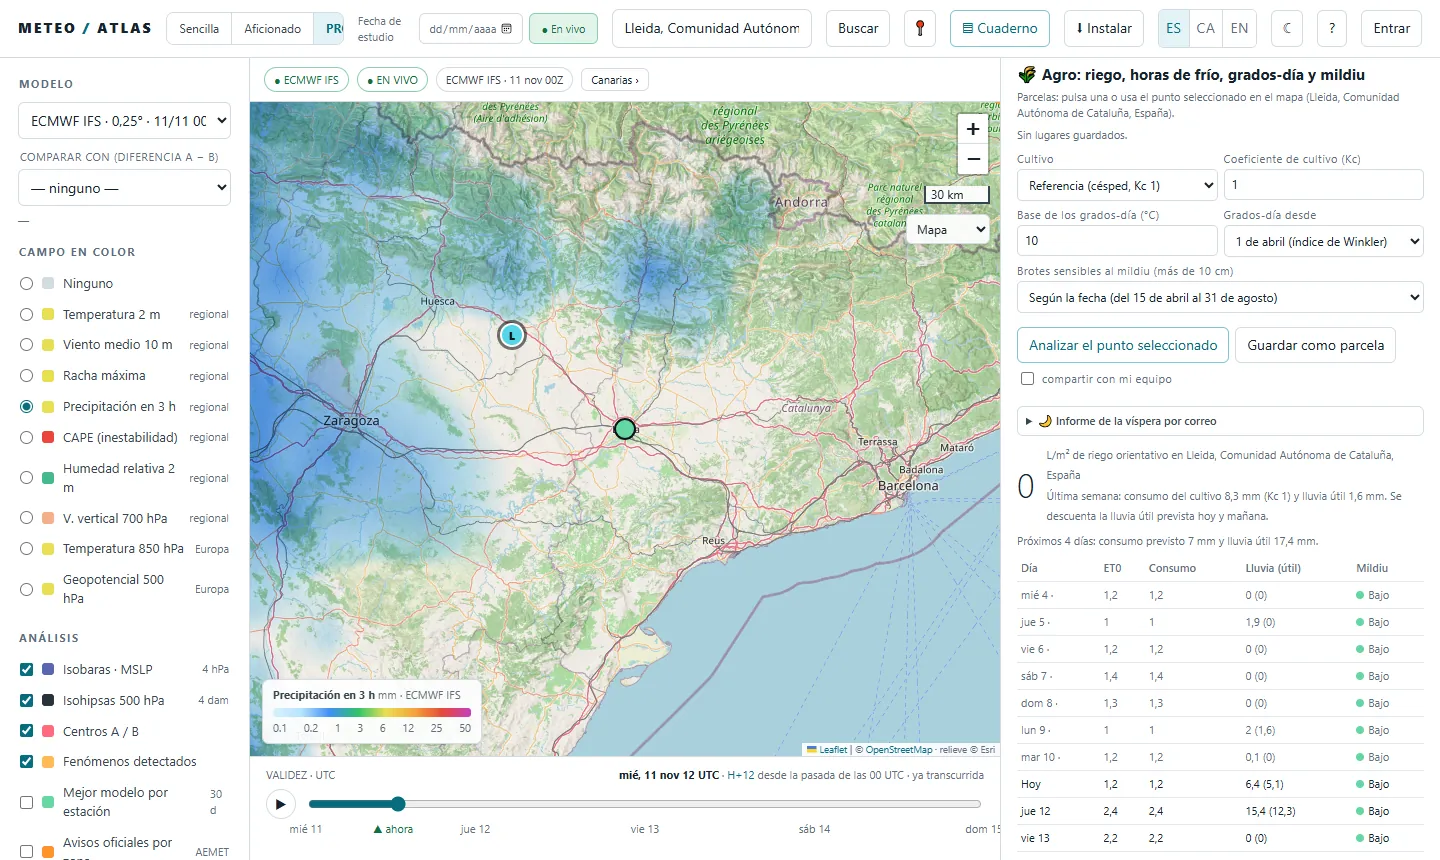
🌾 Farming: shall I water? Is there a risk of downy mildew?
- 1Choose the «Crop» (the Kc coefficient is filled in for you) and press «Analyse the selected point».
- 2Read the indicative irrigation in litres per square metre: what the crop has used over the last week minus the effective rain, and what is expected for the next few days.
- 3Look at grapevine downy mildew, chill hours and degree-days, and print the «🖨 Printable report».
Will it rain? Where and when?
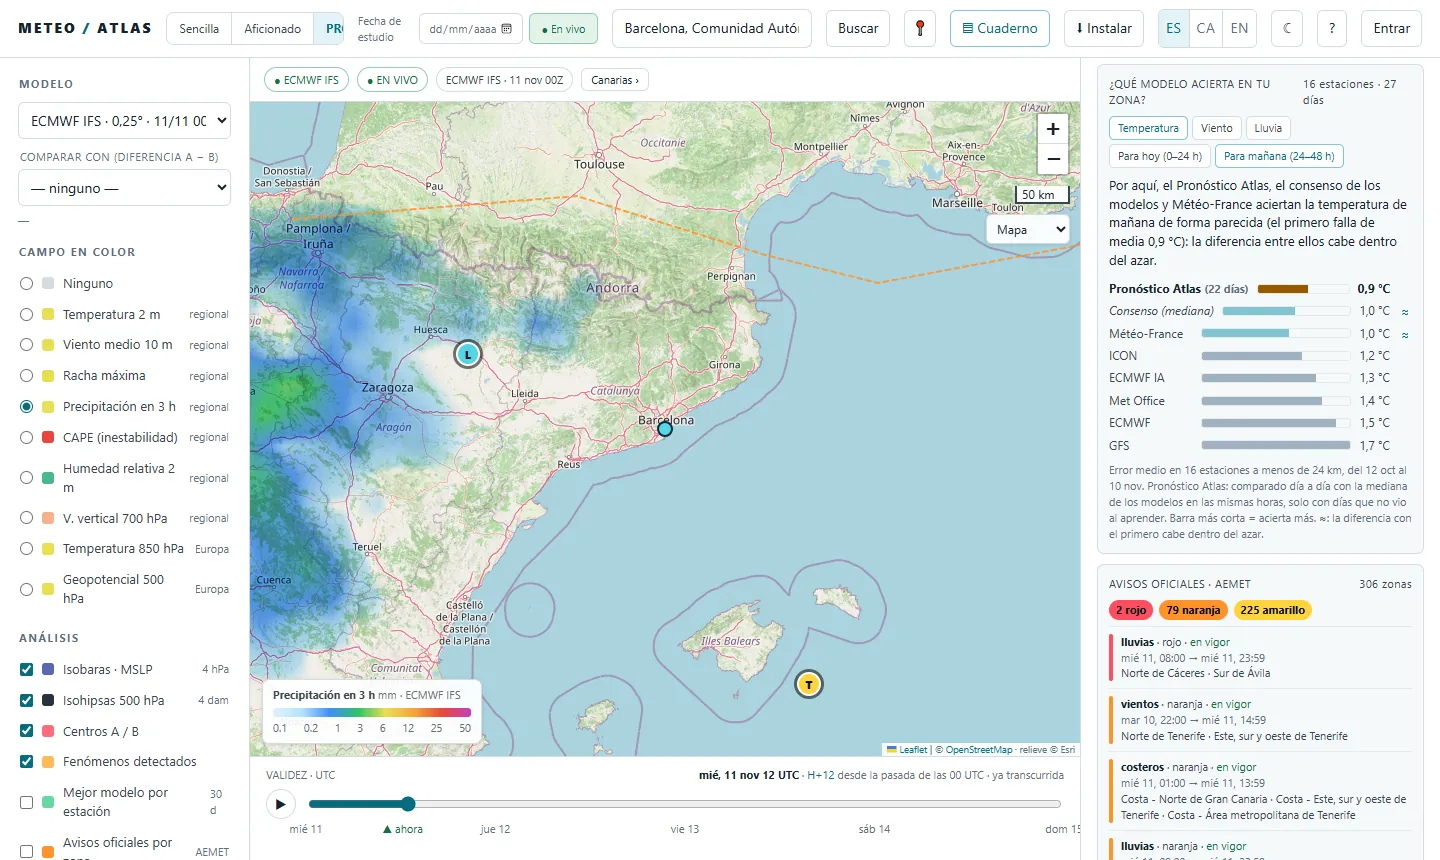
- 1Same as in Enthusiast: «Colour field» → «Precipitation in 3 h» and the time bar (in UTC). The steps are in the Enthusiast guide.
- 2Compare two models at a glance. Under «Compare with (difference A − B)», choose a second model: the map draws the difference between the two, so you can see where one gives more rain than the other.
- 3«Multi-model consensus», in the list of models, draws the median of them all.
Will it be windy? Let me know
- 1On the map, «Maximum gust», as in the Enthusiast guide.
- 2Create your alert in «My alerts». «Alert me at this place if…»: choose the variable (maximum gust, rain in 3 or 24 h, temperature, CAPE, imminent rain on the radar, AEMET warning, lightning nearby…), the condition, the threshold, the time range (24 to 96 h) and how many models have to meet it. Press «Create alert».
- 3Get it even when the website is closed with «📱 Notify me even when the site is closed». Alerts are checked on the server with every model run, and only you can see them.
Are there any warnings?
- 1On the map, «Official warnings by zone · AEMET», as in the Enthusiast guide.
- 2In the «Official warnings · AEMET» list in the right-hand panel, all the warnings for Spain with their level, time and zones, red ones first.
- 3The transport tool takes them into account: an AEMET warning on a stretch shows up as an issue, at the time you will pass.
How far can I trust it? Which model does best here?
- 1Look at «Which model is right in your area?». It ranks the Atlas Forecast, the consensus and each model by their error at nearby stations over the last month, for today or tomorrow, in temperature, wind or rain. The shortest bar is the one that does best; «≈» means the difference is within chance.
- 2«Verification · which model does best» gives each model's error at one, two and three days, and «Best model per station», under «Analysis», draws it on the map.
- 3For the uncertainty of the day, the 50 ECMWF scenarios, as in the Enthusiast guide. The events tool also gives its «confidence», which goes down the further away the day is.
More things you can do
- «🌙 Evening-before report by email»: the evening before, a summary of the next day for your saved cases.
- «share with my team»: your plots, events and routes, visible to your team.
- «Export data»: CSV and GeoJSON, and a public API with a key to plug it into your systems.
- For a specific event, there is also the weather for your event; for local councils and civil protection, the council service.
All the guides, in Guides.
Atlas does not replace official warnings. To make decisions, follow AEMET, Meteocat in Catalonia and Civil Protection.