Dashboard guides · Enthusiast view
The model maps, step by step
The Enthusiast view shows what forecasters use: maps from six models, side by side, and the 50 ECMWF scenarios to know how far to trust them. Here is how to answer the usual questions with them.
Before you start
- 1Open the dashboard in the Enthusiast view and search for your town in the box at the top.
Open the Enthusiast view - 2Find your way around. On the left you choose the model, the «Colour field» (what the map draws) and the layers. In the middle, the map. On the right, the weather for the chosen place. Click anywhere on the map to see the weather there.
- 3The time bar, at the bottom. «Valid time · UTC» tells you which moment you are looking at. Drag it, or press ▶ to animate. Times are in UTC: in winter add 1 hour to get mainland Spanish time, and 2 in summer (03 UTC on a Thursday in November is 4 am).
What will the weather be like tomorrow?
- 1Look at the «Multi-model meteogram». In the right-hand panel: four days of temperature, one line per model, and blue bars for the rain (the median of them all). If the lines stay together, the models agree; if they spread apart, they are unsure.
- 2Choose the time on the time bar and read the four figures at the top (temperature, rain, wind and pressure: the median of the models) and the «Model comparison», with what each one gives at that time.
- 3Read the «Interpretation». It sums up the six hours after the chosen time: how much rain, the strongest gust, whether the pressure is falling fast, whether there is instability for thunderstorms and whether the models agree.
Where and when will it rain?
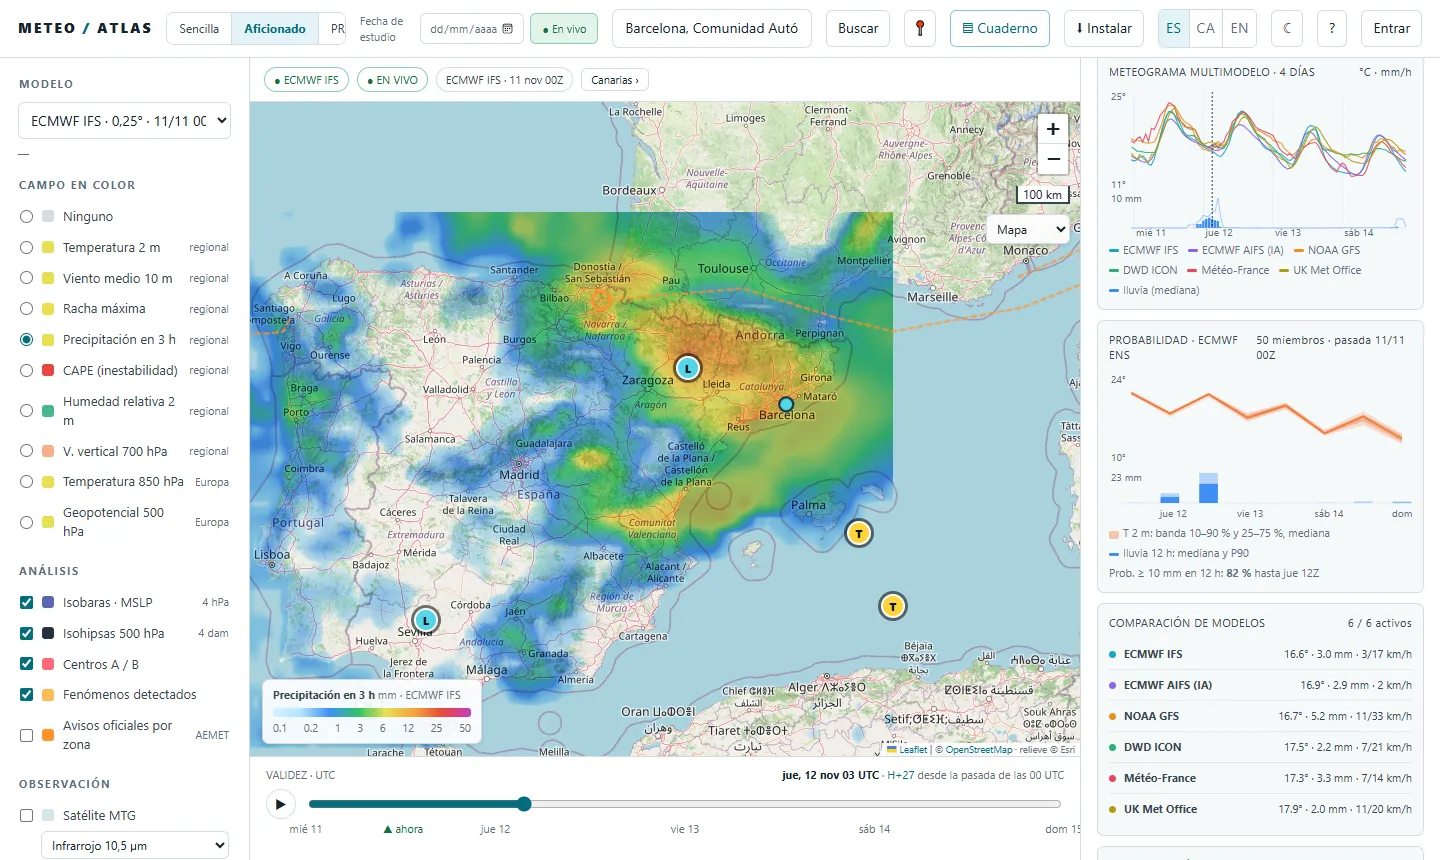
- 1Under «Colour field», choose «Precipitation in 3 h». Each colour is the rain in the three hours before the chosen time: blue, a little; green and yellow, moderate; orange, red and purple, heavy. The scale is at the bottom left of the map.
- 2Move the time bar to tomorrow, or press ▶, and you will see the rain come and go. Click on your area to read the exact value.
- 3Change the model at the top left (ECMWF, the ECMWF's AI, GFS, ICON, Météo-France, Met Office) and compare: if they all put the rain in the same place at the same time, that is a good sign.
- 4On the day of the rain, turn on «Precipitation radar» under «Observation»: the real rain and its path over the next 90 minutes.
Will it be windy?
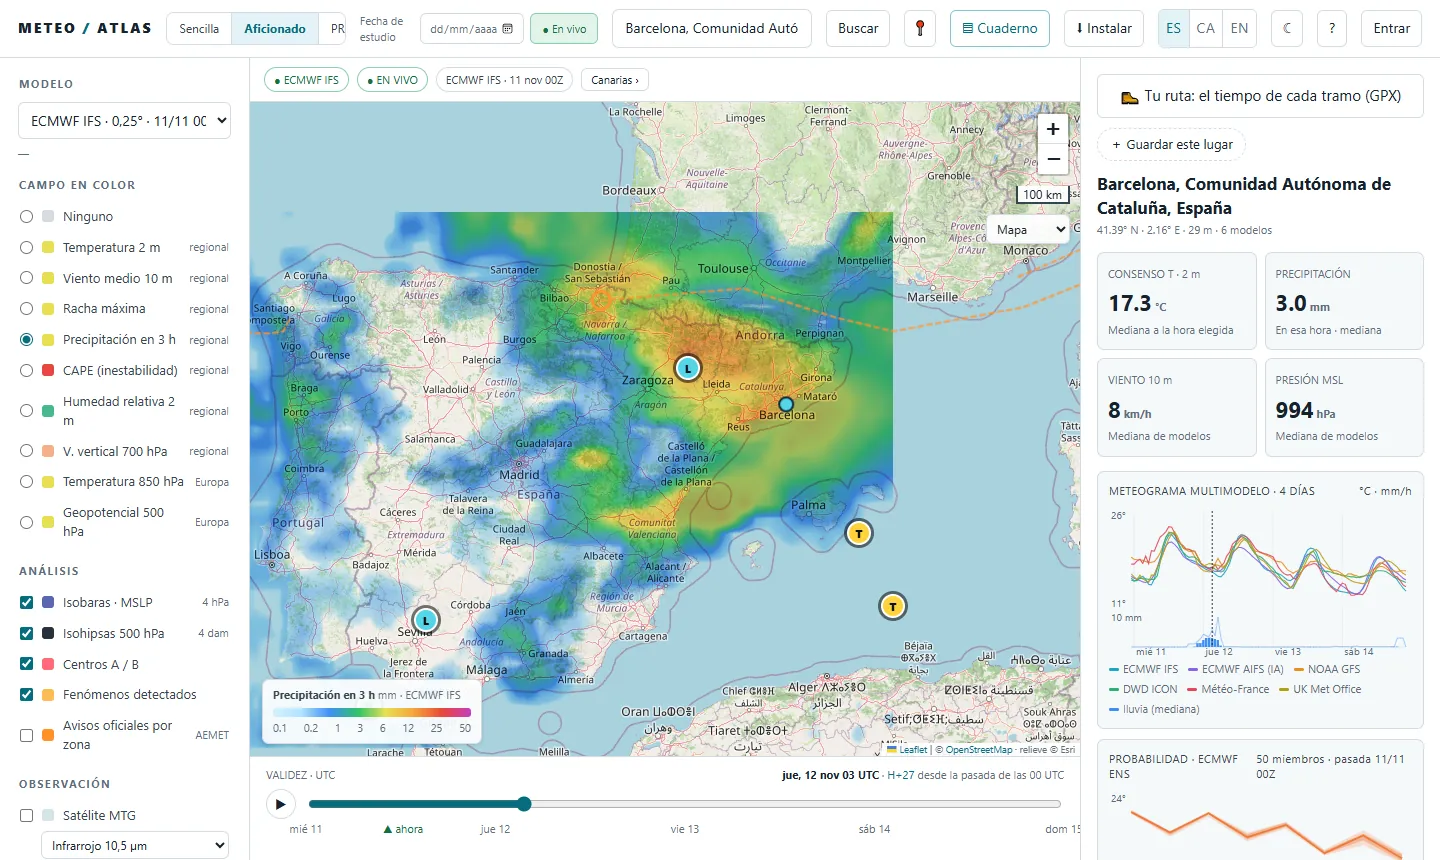
- 1Choose «Maximum gust» under «Colour field»: the strongest gusts expected, in km/h. «Mean wind 10 m» is the sustained wind.
- 2Keep the «Isobars · MSLP» on. Where the lines squeeze together, the wind blows harder. The letters A and B are the highs and the lows.
- 3Look at the «Detected phenomena» list in the right-hand panel: it flags very strong gusts, deep lows, heavy rain or thunderstorms, with their severity and time.
Are there any warnings?
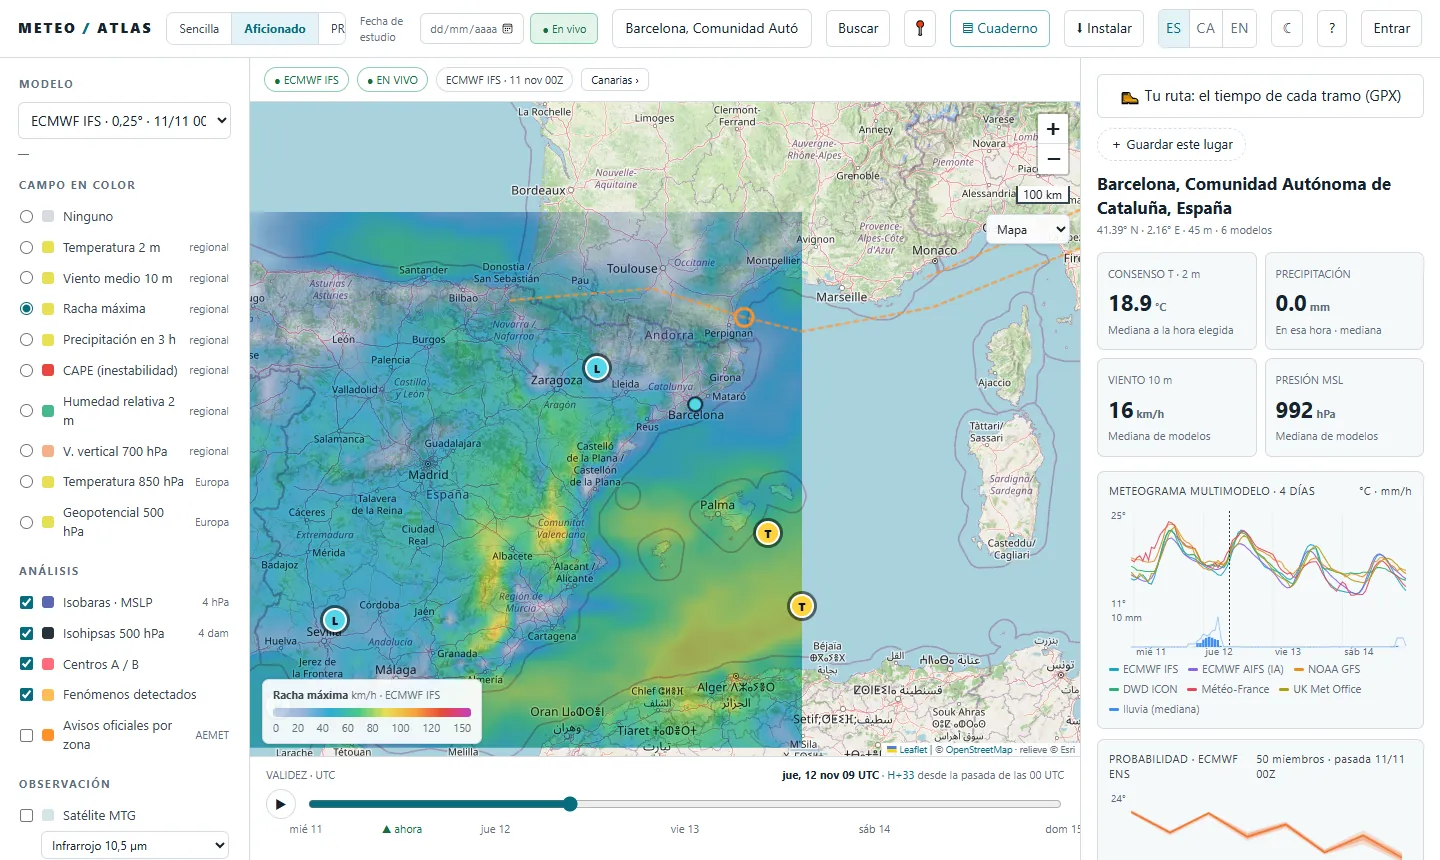
- 1Turn on «Official warnings by zone · AEMET» under «Analysis». The map colours each zone yellow, orange or red: the highest warning it has, current or expected in the next 24 hours.
- 2Set «Colour field» to «None» to see them more clearly.
- 3Click on a zone to read its warnings: what they are for, whether they are already in force and from when until when. What AEMET expects, with its figures, is in the «Official warnings · AEMET» list in the right-hand panel or in the simple view.
How far can I trust it?
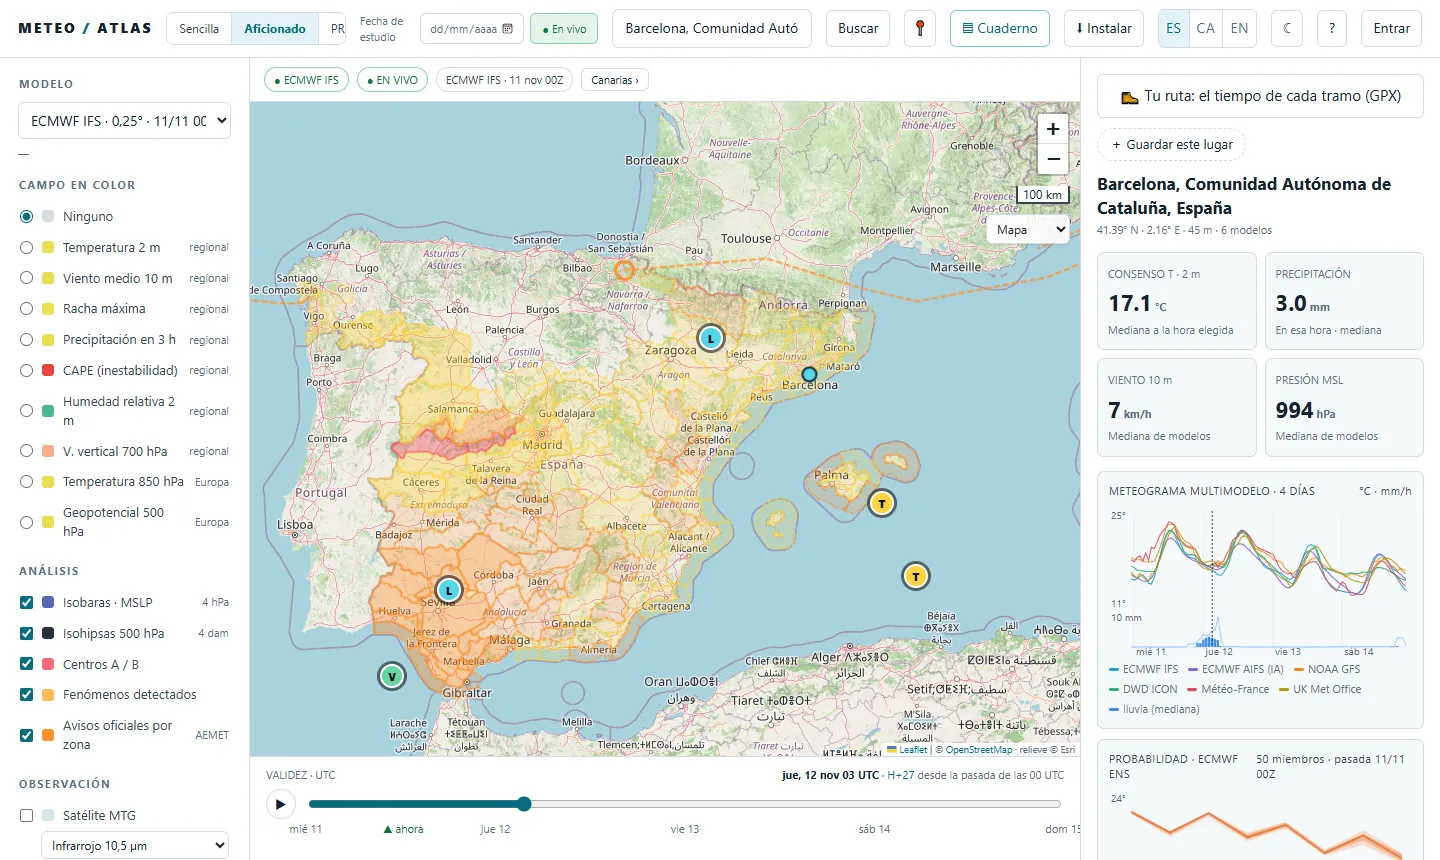
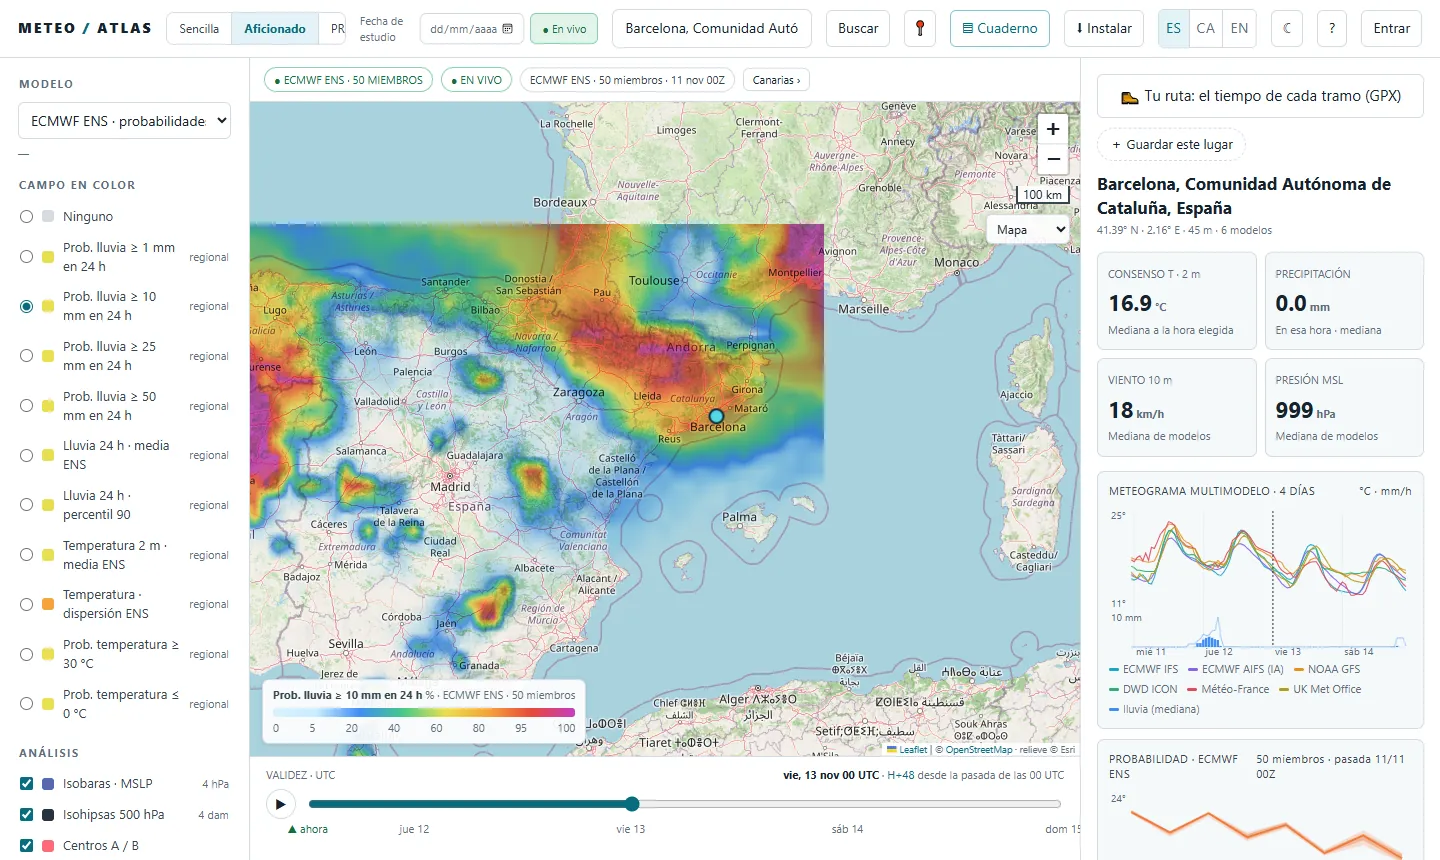
- 1Switch the model to «ECMWF ENS · probabilities». These are 50 scenarios of the same model, each with a small difference at the start. Instead of one figure, they tell you in how many of them something happens.
- 2Choose «Prob. rain ≥ 10 mm in 24 h» (or ≥ 1, ≥ 25, ≥ 50). The colour is the percentage of scenarios: blue, few; red and purple, nearly all. The bar marks the end of the 24 hours: for the whole of Thursday, set Friday at 00 UTC.
- 3In the right-hand panel, «Probability · ECMWF ENS» sums up your point: the temperature band and sentences like «Prob. ≥ 10 mm in 12 h: 82 %».
- 4Which model does best in your area? Further down, that section ranks the models by their error at nearby stations over the last 30 days. If one model shows a lot of rain and the ensemble does not, be wary.
More things you can do
- «Study date», at the top: go back to a past day (since 2022) and see what the models said back then.
- «▤ Notebook»: save your cases to go over them later.
- «My alerts»: «alert me if, here, in the next 24 hours, at least 4 models give more than 20 mm». You need an account.
- «🥾 Your route»: upload a GPX and you will see the weather on each stretch at the time you will pass through it.
- «MTG satellite» and «Lightning · MTG-LI», under «Observation»: the clouds and lightning right now.
To learn how to follow a storm with a real case, see the Episodes. For work, the PRO view guide. All of them, in Guides.
Atlas does not replace official warnings. To make decisions, follow AEMET, Meteocat in Catalonia and Civil Protection.